Mukhbir: Real-Time Anonymous Crime Reporting
July 9, 2020Mukhbir is an urdu word which means a secret agent, in terms of security agencies, Mukhbir is an unsung hidden hero who is always there to provide the most crucial information to the authorities to solve the happening of the crimes. Law and order is a crucial characteristic of progressive, civilized societies. It is a fundamental responsibility of the government to provide a safe and orderly environment that is implemented through various departments and agencies. A highly skilled team of IT industry professionals, experts and researchers at the National Center in Big Data and Cloud Computing (NCBC) affiliated lab Crime Investigation & Prevention Lab (CIPL) - ITU have developed a real-time anonymous crime reporting android application named "Mukhbir", which will facilitate the general public to report crimes happening around them anonymously, so that relevant security authorities can perform suitable actions accordingly. The general public will also have the ability to report and visualize the reported crime details via Mukhbir android application. Mukhbir application can be downloaded via Google play store i.e. https://play.google.com/store/apps/details?id=com.cipl.mukhbir
Mukhbir android application offers following features i.e.
- Anonymous Reporting of Crimes.
- Visualizing Crime Details.
- Visualizing Reported Crimes.
- Filtration of Reported Crimes.

Figure-1: Mukhbir Android Application
1. Benefits of Mukhbir Android Application
For further research and development purpose Mukhbir android application offers following list of suitable benefits i.e.
- Data collection: Real Crime data will be used to inform projections of the resources need for criminal justice agencies to investigate cases and prosecute.
- Temporal analysis: Temporal analysis will help the investigators to simultaneously study the persistence of crime patterns over time.
- Spatial analysis: Spatial analysis will allow to solve complex location-oriented problems and better understand where and what crime is occurring.
- Reaction Analysis: Reaction analysis will able to detect changes in the overall opinion towards crimes in a city.

Figure-2: Benefits of Mukhbir Android Application
2. Analytical Use Cases of Mukhbir
For further research and development case studies, the utilization of Mukhbir application will lead to the following set of analytical use case i.e.
- Hotspot Analysis: Hotspot analysis will help police identify high-crime areas, types of crime being committed, and the best way to respond.
- Hotspot Prediction: Hotspot prediction will help in the prediction of future high-risk crime “hot spots” and enables police precincts to more effectively allocate officers to prevent or respond to incidents.
- Safety Alerts: The android application will alert the end-users for the high crime areas.
- Safe route prediction: Crimes are rising day by day thus safety & security is becoming a major concern for people today. Even while travelling, people should be aware & choose the route which is safest to travel.
- Crime Rate Prediction: This will help reduce the rates of crimes and can help to improve securities in such required areas Real-Time Reporting and Analysis of Mukhbir.
- Reaction Analysis: Reaction analysis will able to detect changes in the overall opinion towards crimes in a city.
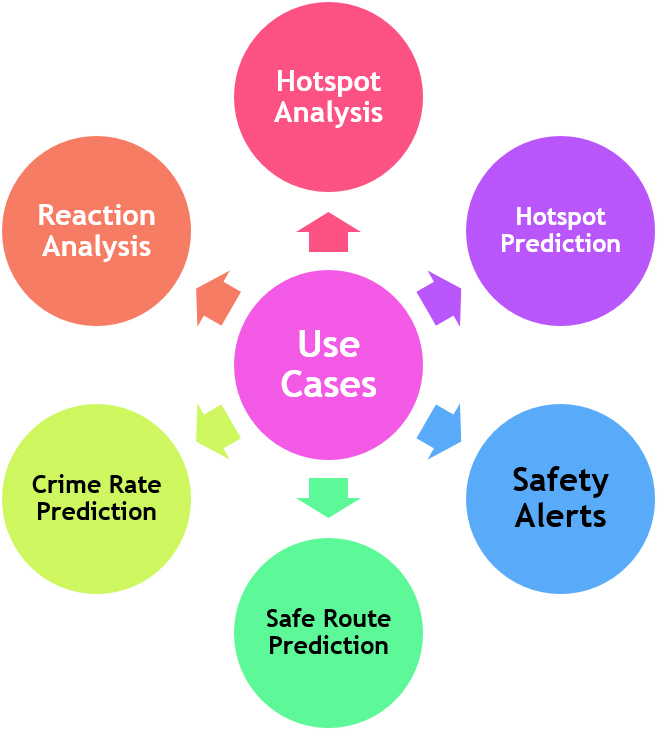
Figure-3: Analytical Use cases of Mukhbir
3. Real-Time Reporting and Analysis of Mukhbir
A Real-Time Analytical Dashboard has been developed, which provides rich interactive in-depth analytical visualizations. Data of the provided dashboard is collected in real-time via Mukhbir android application. Each time a crime is reported via Mukhbir android application, an immediate real-time analysis will be updated on the dashboard. The real-time analytical dashboard is not accessible to the general public, it is developed to share interesting insights with the the relevant authorities in order to perform suitable action. The reporting dashboard provides interesting findings and insights about the reported crimes over the time series, regional base and reported crime categories based analysis.
Figure-4 is showing a glimpse into real-time analytical dashboard with the number of reported crimes over the period of days along with the distribution of the reported crimes across five provinces of Pakistan and the distribution of the reported crimes across multiple reported crime type categories. These crime distributions provide insightful information regarding crime happenings across both provinces of Pakistan and various reported crime type categories.

Figure-4: Real-Time Analytical Dashboard
Figure-5 shows analysis on reported crimes happening over the years and on the days of the month. This analysis benefits in identifying happening of the reported crimes over the period of year and also in identifying the most crucial days of month on which crimes occur mostly.
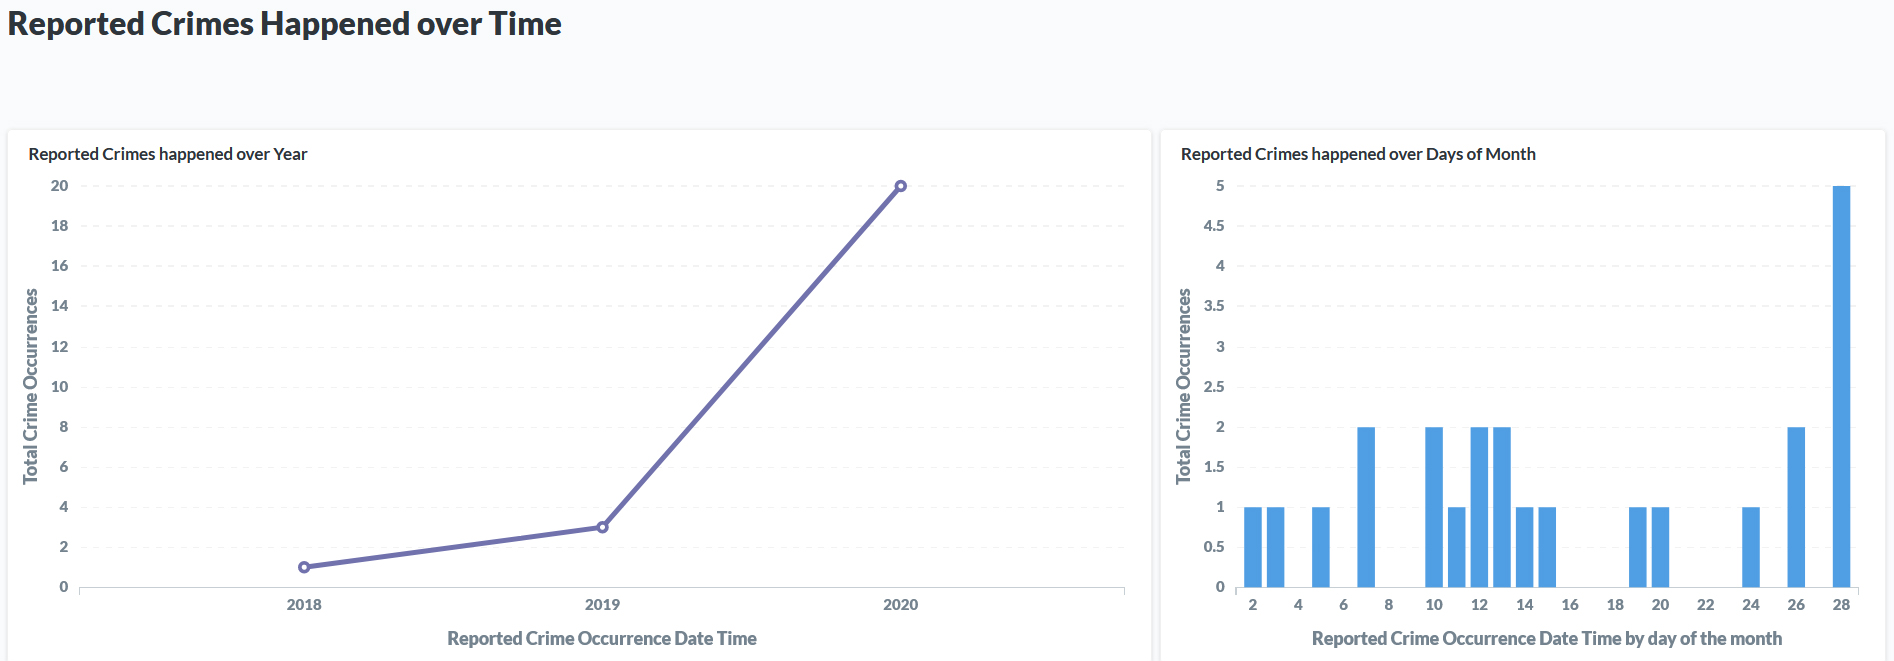
Figure-5: Time Series Analysis
The real-time dashboard provides a geographical glimpse into the crimes reported in Pakistan. This geographical visualization will help in developing an understanding of crime patterns and trends. It will also help in resource allocation and geographic profiling of criminals and suspicious locations. Figure-6 shows reported crimes by location mapping on the geographical map.

Figure-6: Reported Crimes by Location
The geographical map shows the detail of the reported crimes as marked locations are clicked. Figure-7 shows detail information about a particular reported crime marked on the geographical map i.e. latitude, longitude, province, city, area, locality, sublocality and total number of crime occurrences.
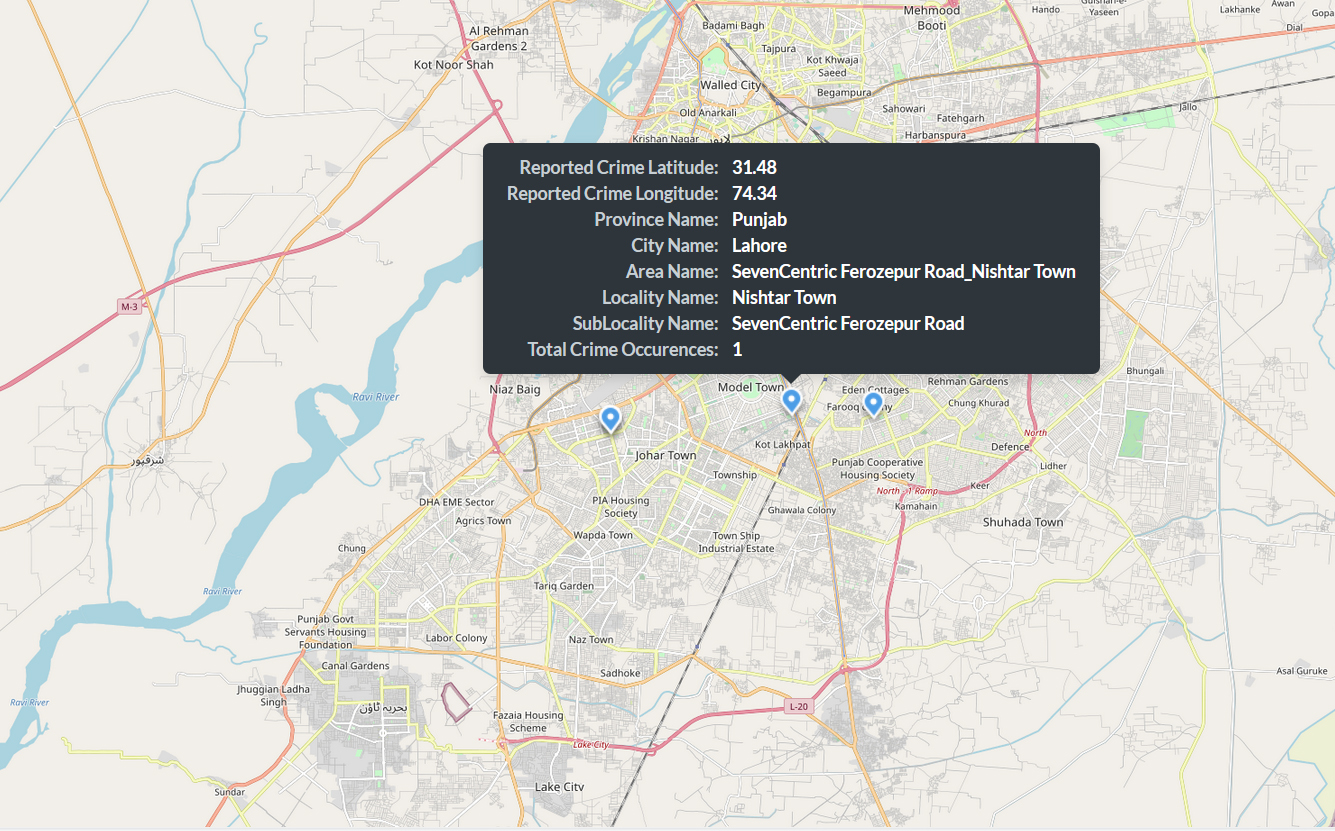
Figure-7: Reported Crimes Detail
The real-time analytical dashboard also provides many filters that are helpful in narrowing down suitable insights to develop more understanding of the reported crime data. Figure-8 shows a list of filters that are available on the dashboard i.e.
- Filter By Reported Crime Data
- Filter by Crime Occurrence Date
- Filter by Crime
- Filter by Province

Figure-8: Filters in Dashboard
Figure-9 shows a glimpse into one of the filters. The analytical dashboard has the ability to cross filter dataset for gaining deeper insights in real-time. For example, in Figure-9, crime type robbery has been selected from the “Filter By Crime” filter.

Figure-9: Filter By Crime
When the filter in Figure-9 is applied then the entire analytical dashboard will be updated as shown in Figure-10 and Figure-11 which are showing the analytical trends for the Robbery.

Figure-10: Results after Choosing Crime Type Robbery

Figure-11: Results after Choosing Crime Type Robbery
4. Analytical Data Ingestion Platform
CIPL team has a separate specialized analytical tool to store, organize, visualize, and display location-based data to easily identify crime patterns. Tool can load different type of datasets like .csv and .geojson. The tool has amazing features of filtering to customize the geographical map. The tool has the features to add multiple layers on the map by uploading different datasets at once. The tool has different map themes like satellite, dark and white.
Pakistan geographical administration has been divided into five provinces, the provinces are further divided into districts/cities. Lahore city has been further divided into various towns and these towns are further divided into multiple union councils. In the first step, the Lahore district boundary dataset has been uploaded into the tool. The town and union councils dataset has been uploaded to see the feature of adding multiple layers and lastly, reported crimes dataset collected via Mukhbir android application has been loaded on top of the union councils.
In Figure-12, the Lahore district boundary dataset has been uploaded into the tool. The dataset consists of only one entry. All towns and union councils of Lahore are in this boundary. Polygons are used to highlight a particular geographical area of a city or a country. The map is showing the polygon boundary for the Lahore city.

Figure-12: Lahore District Boundary
In Figure-13, the Lahore town dataset has been loaded into the tool. The Dataset has 10 entries for the towns in Lahore. All the shapes are Polygon as they are showing the boundary of the town area. The analytical data ingestion platform shows the detailed menu when a particular boundary is selected.

Figure-13: Towns in Lahore
The area of a union council is a territorial unity, whose boundaries do not cross the limits of Metropolitan Area, Municipalities or the District. In Figure-14, the Lahore Union Council dataset has been loaded into the tool. The geographical map is showing the results for the 153 union council entries.

Figure-14: Lahore Union Council
The geographical map can be customized by applying filters. The Filter by column value analysis enables you to filter a map layer by a selected column from your dataset. If you are familiar with using SQL, this is similar to a typical WHERE operation on a database. You can select the column to be filtered and define limits, or a range of values (depending on your data). In Figure-15, Johar town has been chosen and the geographical map is showing the results with only one union council that has been selected.

Figure-15: Filtering of the Map
Lahore district has been divided into ten towns, each town consists of a group of several union councils. The tool can add multiple datasets and all datasets have been loaded with layers. Since each of these polygon data points represents a layer on the geographical map, the tool has a feature of toggling the layers on and off. In Figure-16, three following datasets have been loaded into the tool i.e.
- Lahore District Boundary
- Lahore Town
- Lahore Union Councils

Figure-16: Three Dataset Layers of Map
In Figure 17, reported crimes dataset has been loaded on the geographical map. The points have been loaded on the union council’s layers. The first layer is of the union council boundary and the second layer is of the reported crimes dataset.

Figure-17: Mukhbir Data points on Union Council
5. Conclusion
Mukhbir android application allows general public to voice the injustices faced by them every day as an unsung hero. The goal of this android application is to allow the creation of a safer society. The Mukhbir android application meets the objectives in providing faster and portable reporting system that will be convenient to use by the general public. The android application will be helpful in society such as in solving crime, and faster response by the authority. With the collection and analysis of crimes prevalent in an area, one can construct better systems or devise better policies to aid in creating a safer environment.