Crime Statistics
February 24, 2020Deterring and punishing crime is one of the fundamental responsibilities of a state. Rising crime and deteriorating public safety can discourage investment and business activity, damage property, and reduce the quality of life, forcing people to live in fear and unease. In Pakistan in the period leading to 2013, crime was on the rise, due to a variety of socio-political factors combined with an overstretched government fighting against various terrorist groups. The data we have used considers the end of that period, when from 2013 onwards, in Sindh the police and federal security agencies launched operations to dismantle criminal gangs in Karachi, and in Punjab various reforms and initiatives such as the Dolphin Police in Lahore were initiated.
The data analysis has been divided into two parts. Citizens Police portal has been used to analyze the monthly crime statistics of Sindh from 2011-2014. Moreover, Punjab and Sindh development statistics have been used to draw a yearly comparison of reported crimes between Sindh and Punjab.
Beginning with Sindh, the crime categories recorded were murder, murder in the form of target killing, murder during dacoity/robbery, highway dacoity/robbery, bank dacoity/robbery and car snatching. The time period was from January 2011 to December 2014, and data was recorded on a monthly basis. The time period is interesting because of the rapidly changing crime trends in Karachi during those years. Initially crime levels were increasing in Karachi, driven primarily by murders. This was in part due to the spiraling ethno-political conflict in the city, spearheaded by various gangs affiliated with different political parties. From August 2011 to July 2013 the number of murders in the city was steadily rising, however the trend reversed after the 2013 Police and Rangers operation, with an initial steep decline in murders followed by a slow and gradual decline. The graph below shows the trends for murders and targeted killings in Karachi over our time period.
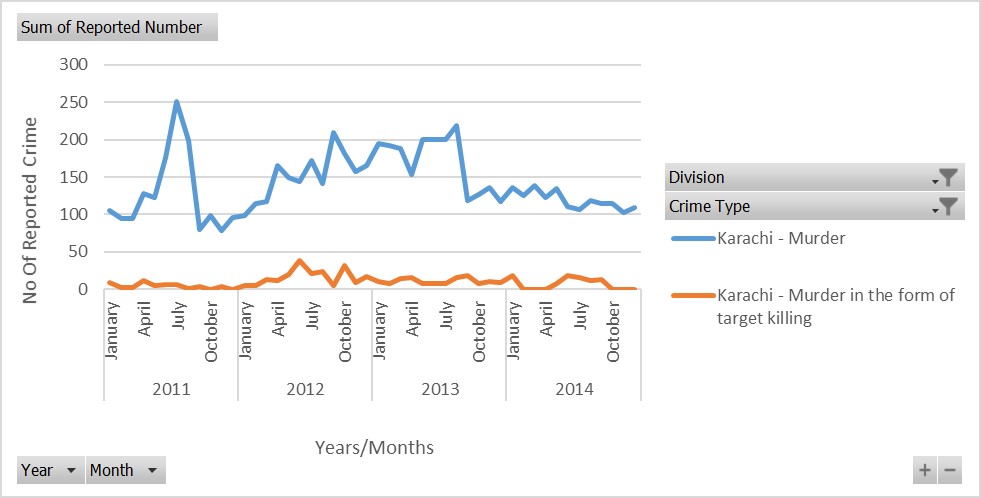
The number of targeted killings did not, surprisingly seem to show any relation with major political trends in the city, except the spike in 2012 coinciding with the start of the Lyari operation in April. However, given media reports of the large number of targeted killings committed in the city (with some captured murderers confessing to over 400 such killings), the numbers appear to be too low. Perhaps this might be due to misclassification of targeted murders as normal murders or due to the difficulty in identifying individual targeted killings.
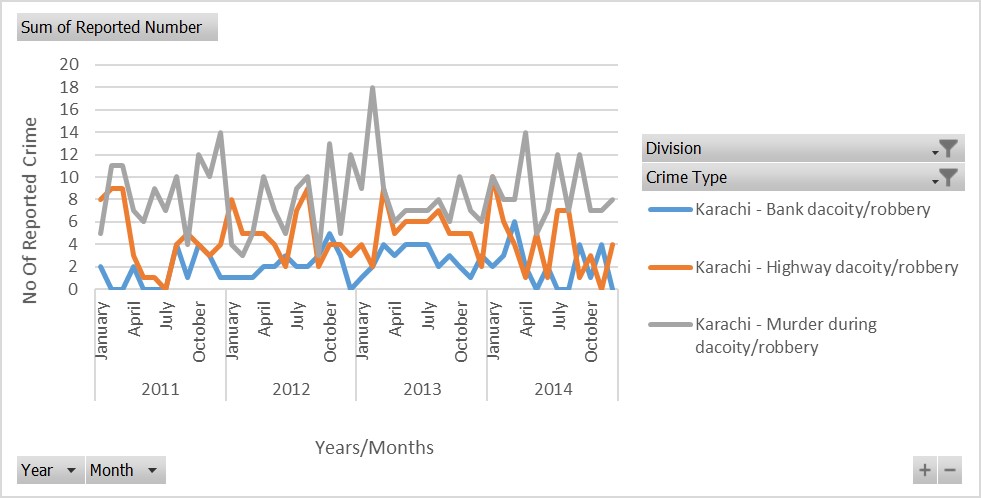
It is interesting to note that although the operation targeted primarily the criminals involved in rival political party affiliated gangs, crime levels for all crimes in the city initially fell as a result. One would expect that only targeted murders would fall, but all categories of crime that we looked at registered a decline. This could have been due to either the fact that the gangs targeted by the 2013 operation were also engaged in crimes such as bank robberies and car snatchings, or that the decay of security in the city had encouraged other, petty criminals to commit crimes. It should be noted however, that crimes increased substantially in the months after the operation for highway robberies, bank robberies and the murders during robberies, suggesting that the decrease was only temporary, perhaps due to criminal gangs adjusting their methods, stopping criminal activities for a while. However the decrease in overall murders in the city seems permanent. The graph below shows data for Bank robberies, highway robberies and Murder during these robberies.
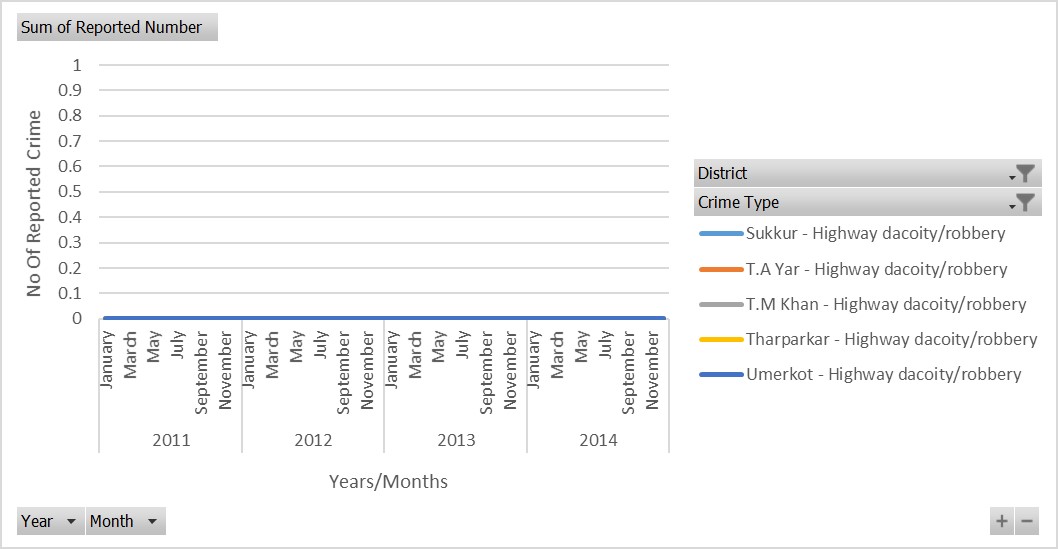
Beyond karachi, crime levels in Sindh did not change much, and the overall trends were largely in part driven by Karachi’s crime numbers. An interesting reason for this might be that non-murder crime levels for most of the districts in Sindh were extremely low, and this itself might be due to non-reporting of crimes by victims, or more disturbingly, due to police stations not recording crimes committed. Either way, this calls the accuracy of Police data outside the major cities in question, and it might be that the total number of crimes committed in Sindh is much higher than the data shows. However the data for murders seemed accurate, perhaps because they were deemed important enough to record by the police. As an example of the absurdly low crime numbers, the graph below is for highway robberies in 5 districts of Sindh over 4 years.
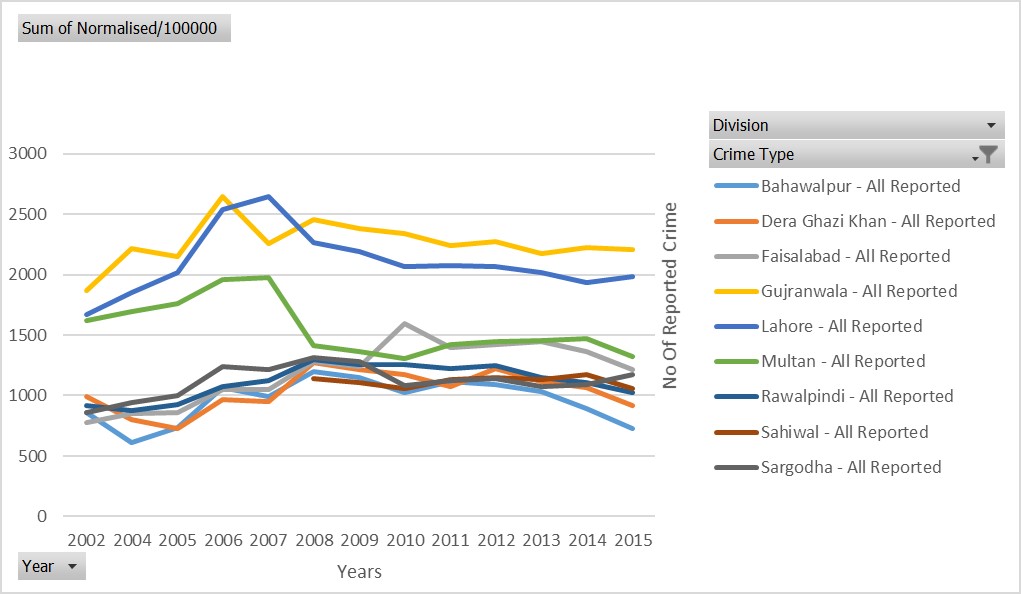
For Punjab, the data was collected on an yearly basis, from 2002 to 2015, with crime levels gradually decreasing across Punjab for murders and attempted murders. As well as various kinds of theft such as cattle theft, dacoity etc. However various other types of crime steadily increased, such as motor theft, and rape. Overall the results suggest that crime levels per capita in Punjab are gradually declining for most divisions, and this might be attributed to a number of reasons, such as better policing. The Graph below shows the trend for all reported crimes, normalized per 100,000 people.
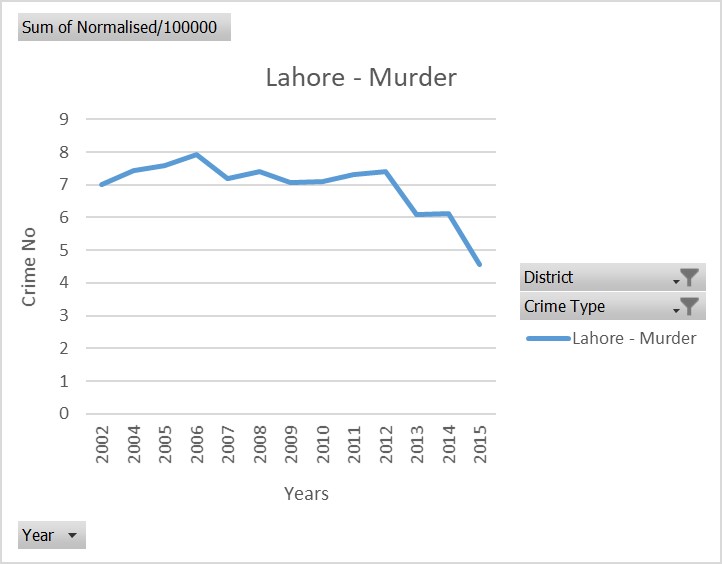
Lahore has shown a steep decline in Murders from 2012 onwards (again normalized per 100,000 people), this might be due to the increase in police numbers in the city. However overall crime of all types in Lahore has increased substantially from 2014 onwards, and this might have been one of the impetuses for establishing the Dolphin Force in 2015. The graph below shows the trend for murders in Lahore.